OmicsNet: Integrating data from multiple omics modalities to build and analyze feature-level networks.
Published:
Introducing OmicsNet: Multi-Omics Integration Without Sample Overlap
The Challenge: Integrating Multi-Omics Data Without Sample Overlap
In the era of big data and systems biology, integrating multiple omics layers—such as transcriptomics, proteomics, metabolomics, and even high-content imaging—has become essential for unraveling complex biological mechanisms. However, a persistent challenge remains: what if your datasets have no overlapping samples?
This is a scenario I encounter frequently as a computational biologist. Collaborators often approach me with rich, multi-modal datasets collected from different cohorts, time points, or even entirely different studies. The question is always the same:
“Can we integrate these datasets to find meaningful biological relationships, even though the samples don’t overlap?”
Traditional integration methods typically require at least some shared samples across modalities. Without overlap, most tools either discard valuable data or force artificial intersections, leading to loss of information and biological insight.
The Solution: OmicsNet
To address this gap, I developed OmicsNet—a Python package designed to integrate multi-omics data at the feature level, even when there is zero sample overlap across modalities.
OmicsNet enables researchers to:
- Integrate transcriptomics, proteomics, metabolomics, cell painting, and more
- Work with datasets of any size and any number of features or samples
- Build integrated networks that reveal functional relationships between features across modalities
- Visualize and explore these networks interactively
How Does OmicsNet Work?
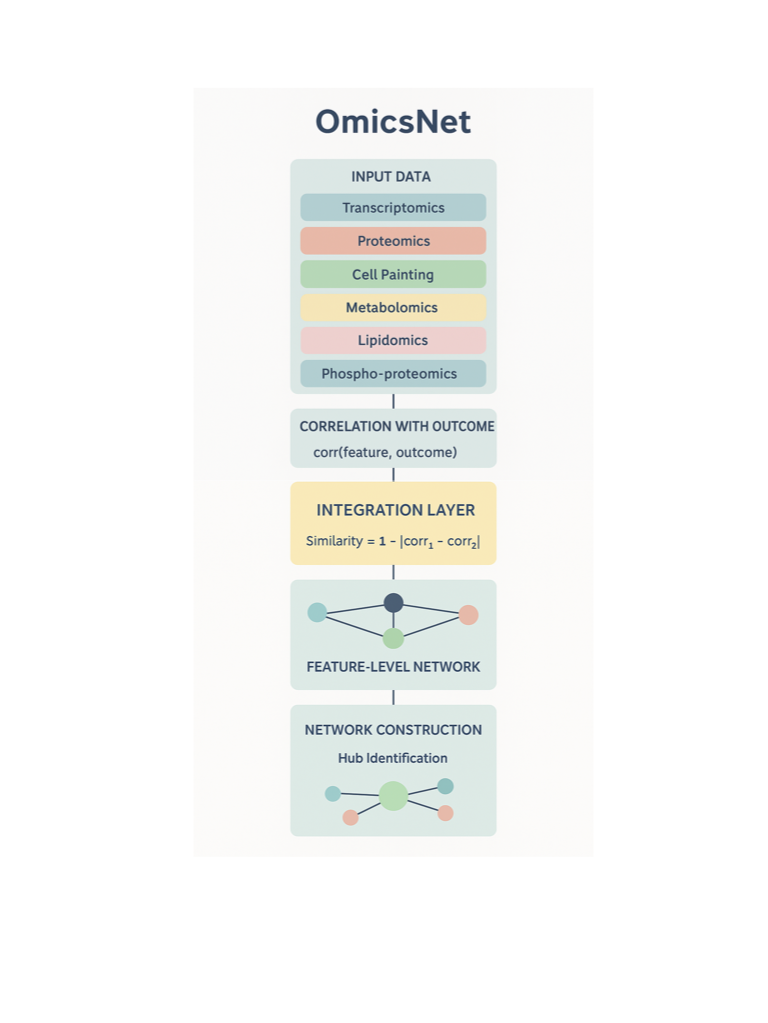
OmicsNet leverages a feature-level association approach:
Correlation with Outcome:
Each feature in every modality is correlated with a common outcome variable (e.g., disease status, age, risk score).Cross-Modal Similarity:
Features from different modalities are compared based on their correlation patterns with the outcome.
For example, if a gene and a metabolite both strongly associate with disease status (even in different sample sets), they are considered similar.Network Construction:
Features with similar association patterns are connected, forming an integrated network that spans all modalities.Hub Identification:
Central features that link multiple modalities are identified as potential key drivers or biomarkers.
This approach allows OmicsNet to integrate data without requiring any shared samples, making it uniquely suited for real-world, heterogeneous datasets.
Key Features
- Zero Sample Overlap Required: Integrate any omics datasets, regardless of sample overlap.
- Multi-Modal Support: Handle transcriptomics, proteomics, metabolomics, cell painting, and custom data types.
- Flexible Outcome Types: Supports binary, continuous, and multinomial outcomes.
- Interactive Dashboard: Explore networks in real-time with drag-and-drop nodes and parameter controls.
- Publication-Ready Visualizations: Generate both static and interactive network plots.
- Export for Pathway Analysis: Easily export networks for downstream analysis in Cytoscape or other tools.
Example Workflow
Here’s a quick example of how you might use OmicsNet in your research:
from omicsnet import OmicsIntegrator, NetworkVisualizer, export_network

# 1. Initialize integrator and add modalities
integrator = OmicsIntegrator()
integrator.add_modality('transcriptomics', tx_data, tx_outcome, tx_features, 'gene')
integrator.add_modality('proteomics', px_data, px_outcome, px_features, 'protein')

# 2. Compute similarities and build network
integrator.compute_similarity_matrices()
network = integrator.build_network(similarity_threshold=0.85)

# 3. Visualize and export
visualizer = NetworkVisualizer(network)
visualizer.plot_static(save_path='network.png')
visualizer.plot_interactive(save_html='network.html')
export_network(network, output_dir='results', prefix='integrated_network')
You can also launch an interactive dashboard to explore your network in real time:
from omicsnet import launch_dashboard
launch_dashboard(network=network)
Why OmicsNet?
OmicsNet fills a critical gap for researchers working with multi-omics data from disparate sources. By focusing on feature-level associations with a common outcome, it enables integration and discovery even when traditional methods fall short.
Whether you’re studying disease mechanisms, identifying biomarkers, or exploring systems biology, OmicsNet empowers you to make the most of your data—no matter how it was collected.
Get Started
OmicsNet is open source and available on GitHub:
👉 https://github.com/shivaprasad-patil/OmicsNet
Installation is simple:
git clone https://github.com/shivaprasad-patil/OmicsNet.git
cd OmicsNet
pip install -e .
For interactive dashboard features:
pip install -e ".[dev]"
Join the Community
I welcome feedback, questions, and contributions!
If you use OmicsNet in your research, please cite the project and share your results.
Let’s unlock the full potential of multi-omics integration—even when your samples don’t overlap.
#MultiOmics #Bioinformatics #DataIntegration #Python #OmicsNet #SystemsBiology #OpenSource #NetworkBiology
📂 GitHub Repository: OmicsNet